A services business does not have a 97% gross margin.
That is what a P&L built from the chart of accounts alone will say about a lot of them. The arithmetic behind it is flawless. The number is still useless for pricing a project, planning a hire or answering an investor.
This article walks through one company’s books, end to end: why the accounting P&L and the management P&L of the same company disagree, how Finrely gets from one to the other, what has to match between them and what is meant to differ, and how you check every change yourself. The company is Larkspur Digital, a fictional US agency. Its 24 months of books go through the same pipeline a connected QuickBooks, Xero, Zoho Books or Odoo file goes through - nothing on the screens below was drawn by hand.
The chart of accounts answers a different question
A chart of accounts is built to satisfy a tax authority and an auditor. It answers “what kind of cost is this?” A management P&L has to answer “what is this cost for?”, and the two questions split the same money differently.
Larkspur’s books show the usual pattern. All salaries sit in one payroll account, whether the person delivers client work, sells, or runs finance. The only thing separating them is a cost centre tag on each posting. Contractors, freelancers, outside services, project supplies and stock media sit in general operating expenses, because that is the account type they were opened under years ago. The one account typed as cost of goods sold holds media and production costs, and nothing else.
Read by account type, that gives you this:
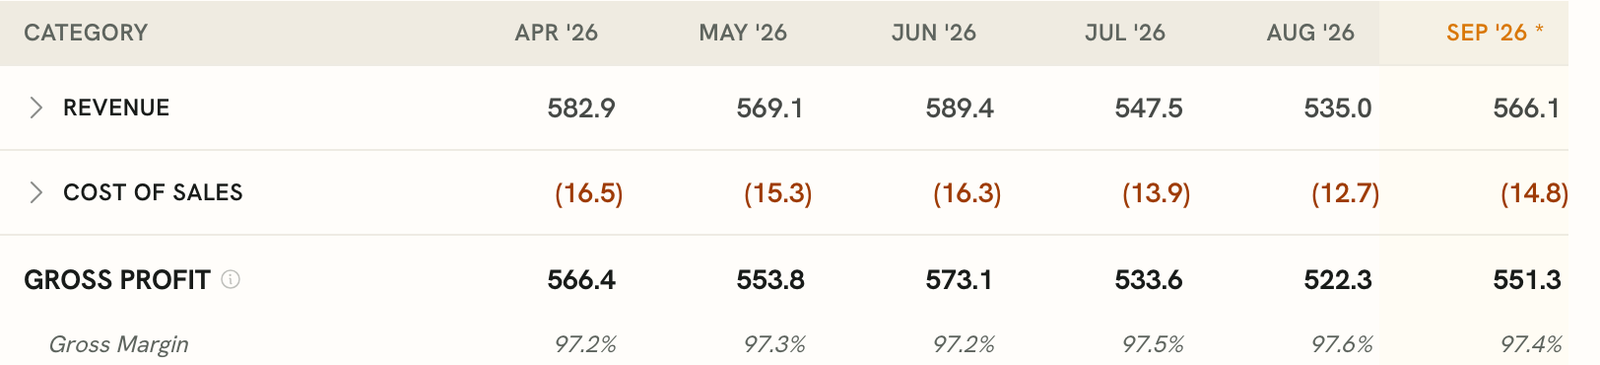
Cost of sales of about $15,000 a month against revenue of about $560,000. A 97% gross margin, for a business whose product is people’s time.
What normalization actually does
Finrely builds the management P&L in a fixed order, the same for every accounting system it reads.
Every account starts on the line its own type gives it. Income goes to revenue, cost of goods sold to cost of sales, expenses to operating expenses. This is your books, untouched, and it is what the As booked view shows.
Rules refine the obvious cases. An account called “Rent” or “Bank fees” lands on administrative expenses, “Advertising” on marketing, “Interest expense” below the operating line. Most accounts in most companies are settled here.
An AI model handles what the rules cannot place. “Contract labor” is cost of sales for an agency and overhead for a software company. Nothing in the account name settles it, so the model decides from what the company actually earns from: its revenue accounts, their shares, and the split of revenue by business line, category or project where the books carry that analytics. A company description and website, if you gave them, are used as a hint, not as a requirement - most companies never fill them in, and the decision has to work without them. The model’s answer is applied only when it is confident enough. When it is not, the account stays in general operating expenses rather than being guessed into a line.
Cost centres and categories decide the line for tagged postings. Each cost centre or category gets a role - cost of sales, sales and marketing, technology, R&D, general and administrative - from a rule on its name or, again, from the model. A salary posting tagged “Client Delivery” then lands in cost of sales, the same salary account tagged “Admin & Finance” lands in G&A. Untagged postings stay where the account puts them.
Nothing here touches your accounting system. Finrely reads your books and builds the report; your accountant’s P&L stays exactly where they left it.
On Larkspur, the result is this:
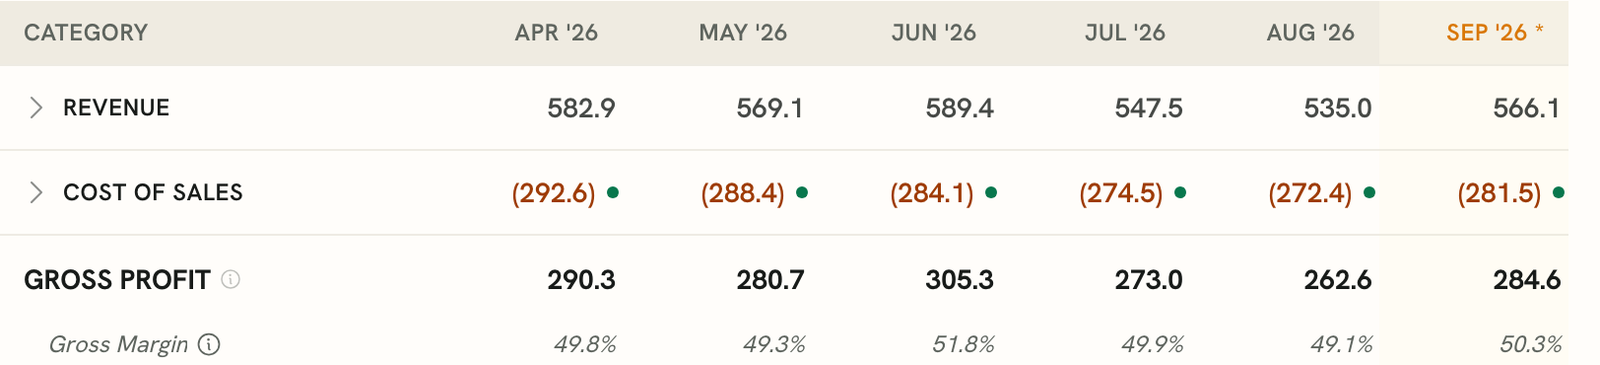
A 50% gross margin. That is the number you would price against.
What must match, and what is meant to differ
Here are both views of the last twelve months side by side, as Finrely’s reconciliation report shows them:
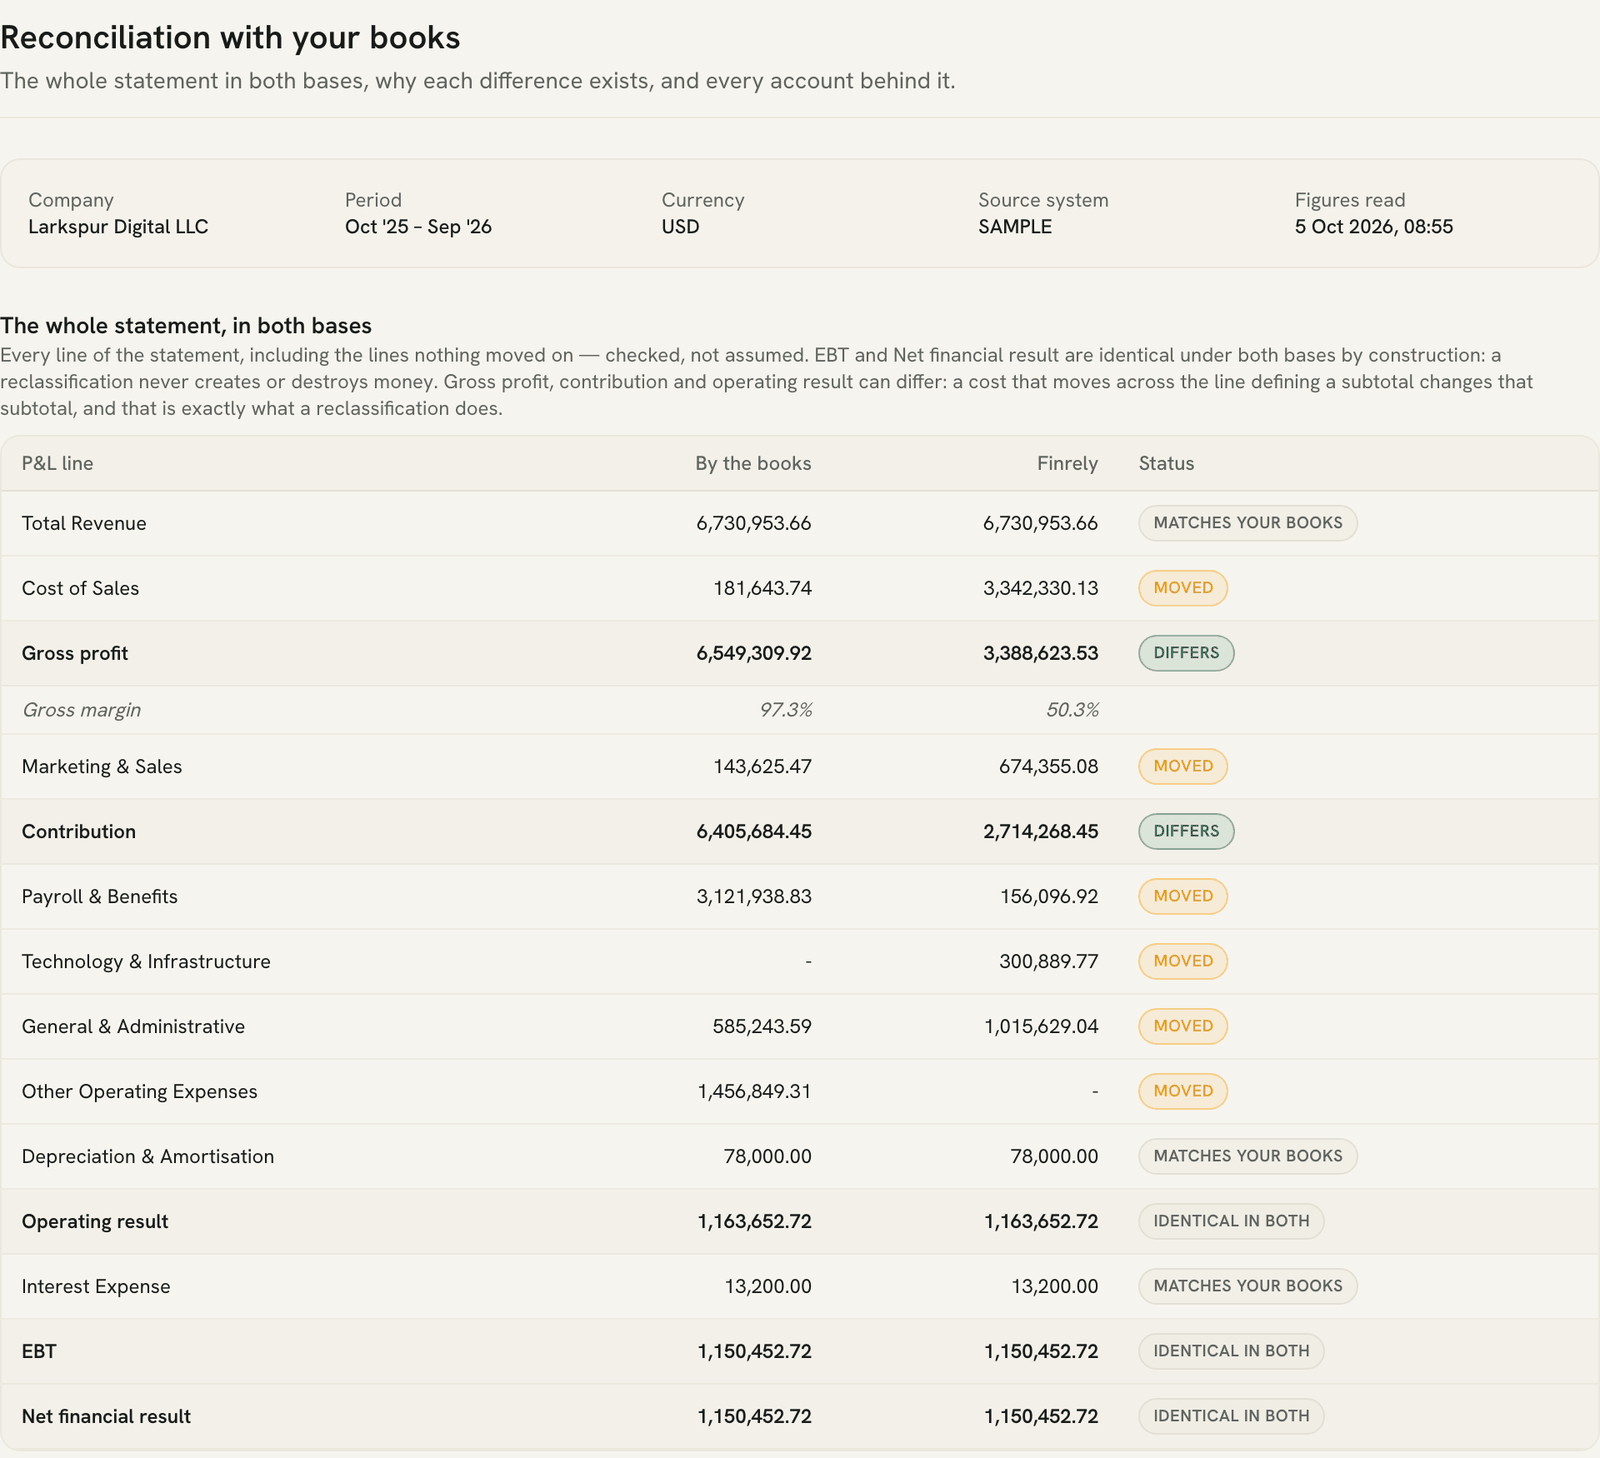
Two things are true at once, and both have to be said.
The bottom line is identical. Revenue, operating result, EBT and the net result all match to the cent; EBT and the net result are $1,150,452.72 in both views. Moving a cost from one line to another never creates money and never removes it. If a tool’s bottom line disagrees with your books, that is a data problem, and it should be treated as one.
Gross profit and contribution are meant to differ. That is the whole reason a management view exists. A tool that tells you every subtotal matches your accounting P&L is either not regrouping anything, or it is not telling you the truth about one of those subtotals.
It also goes the other way. On books where engineering salaries were once booked straight into cost of goods sold, regrouping moves cost out of cost of sales and pushes gross margin up instead of down. The direction depends entirely on what the chart of accounts got wrong, which is why the answer cannot be a fixed rule.
Every change, and who decided it
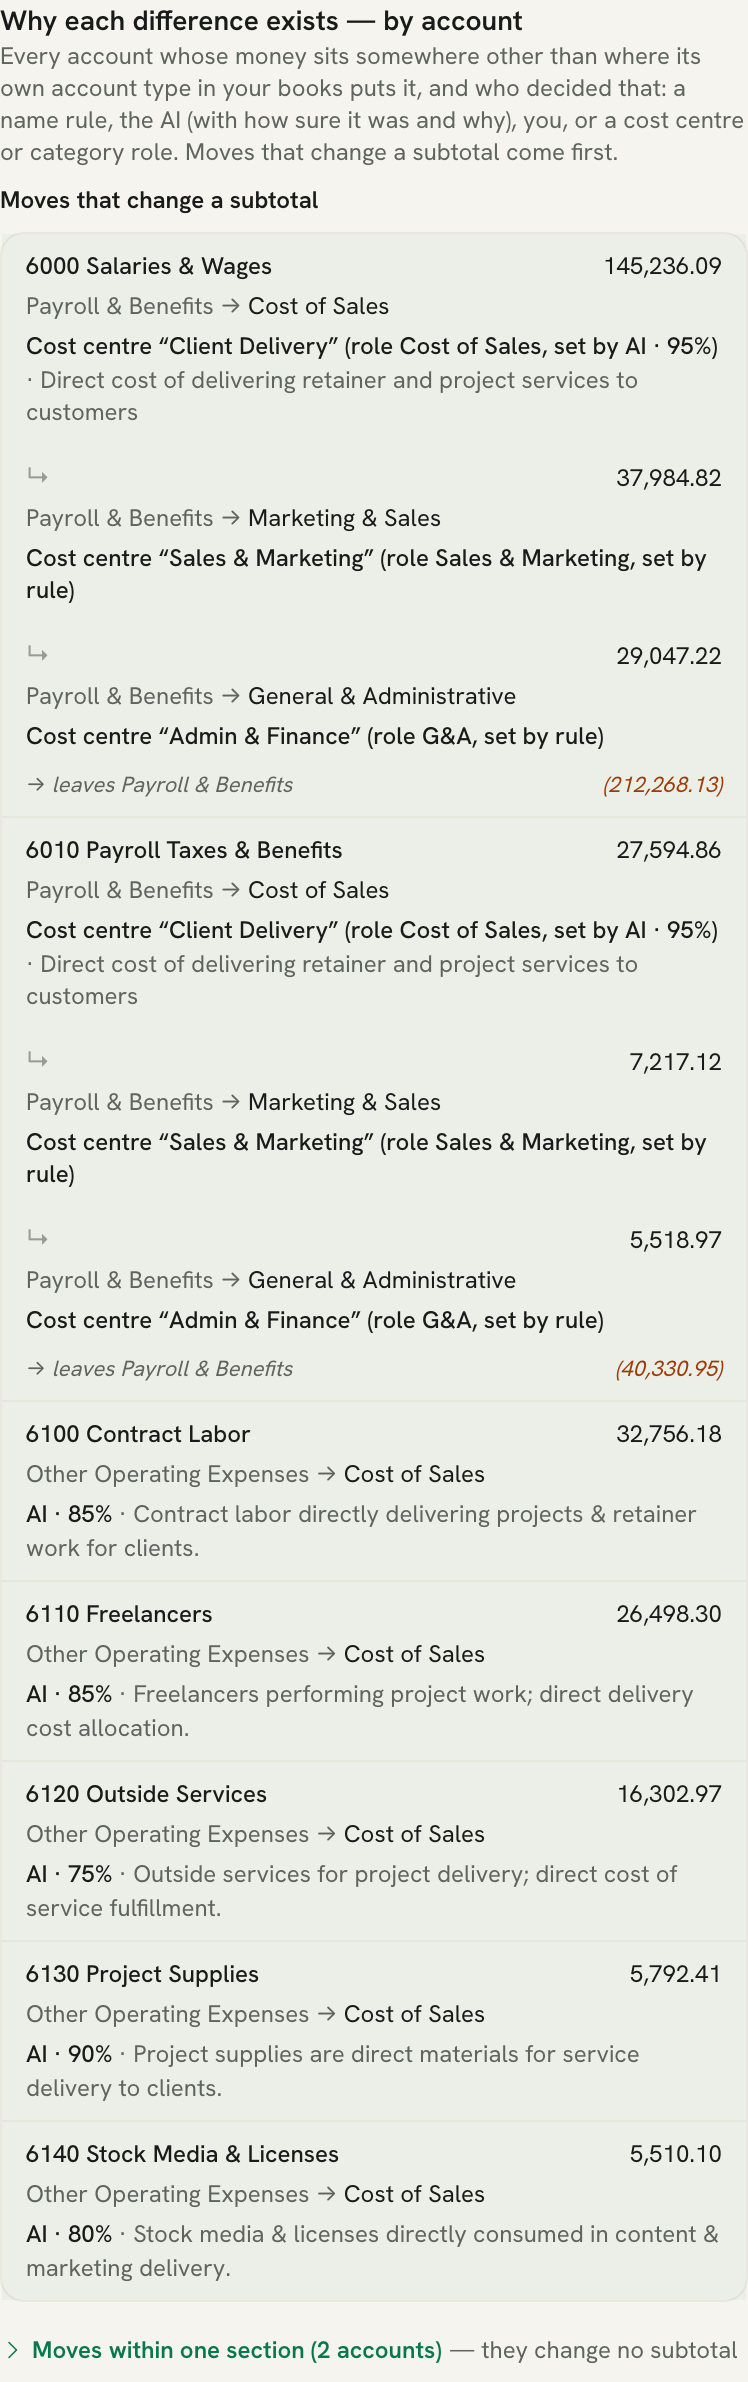
A margin that moved by 47 points needs an explanation you can check, not a methodology note. The reconciliation report lists every account whose money sits somewhere other than where its own type in your books puts it:
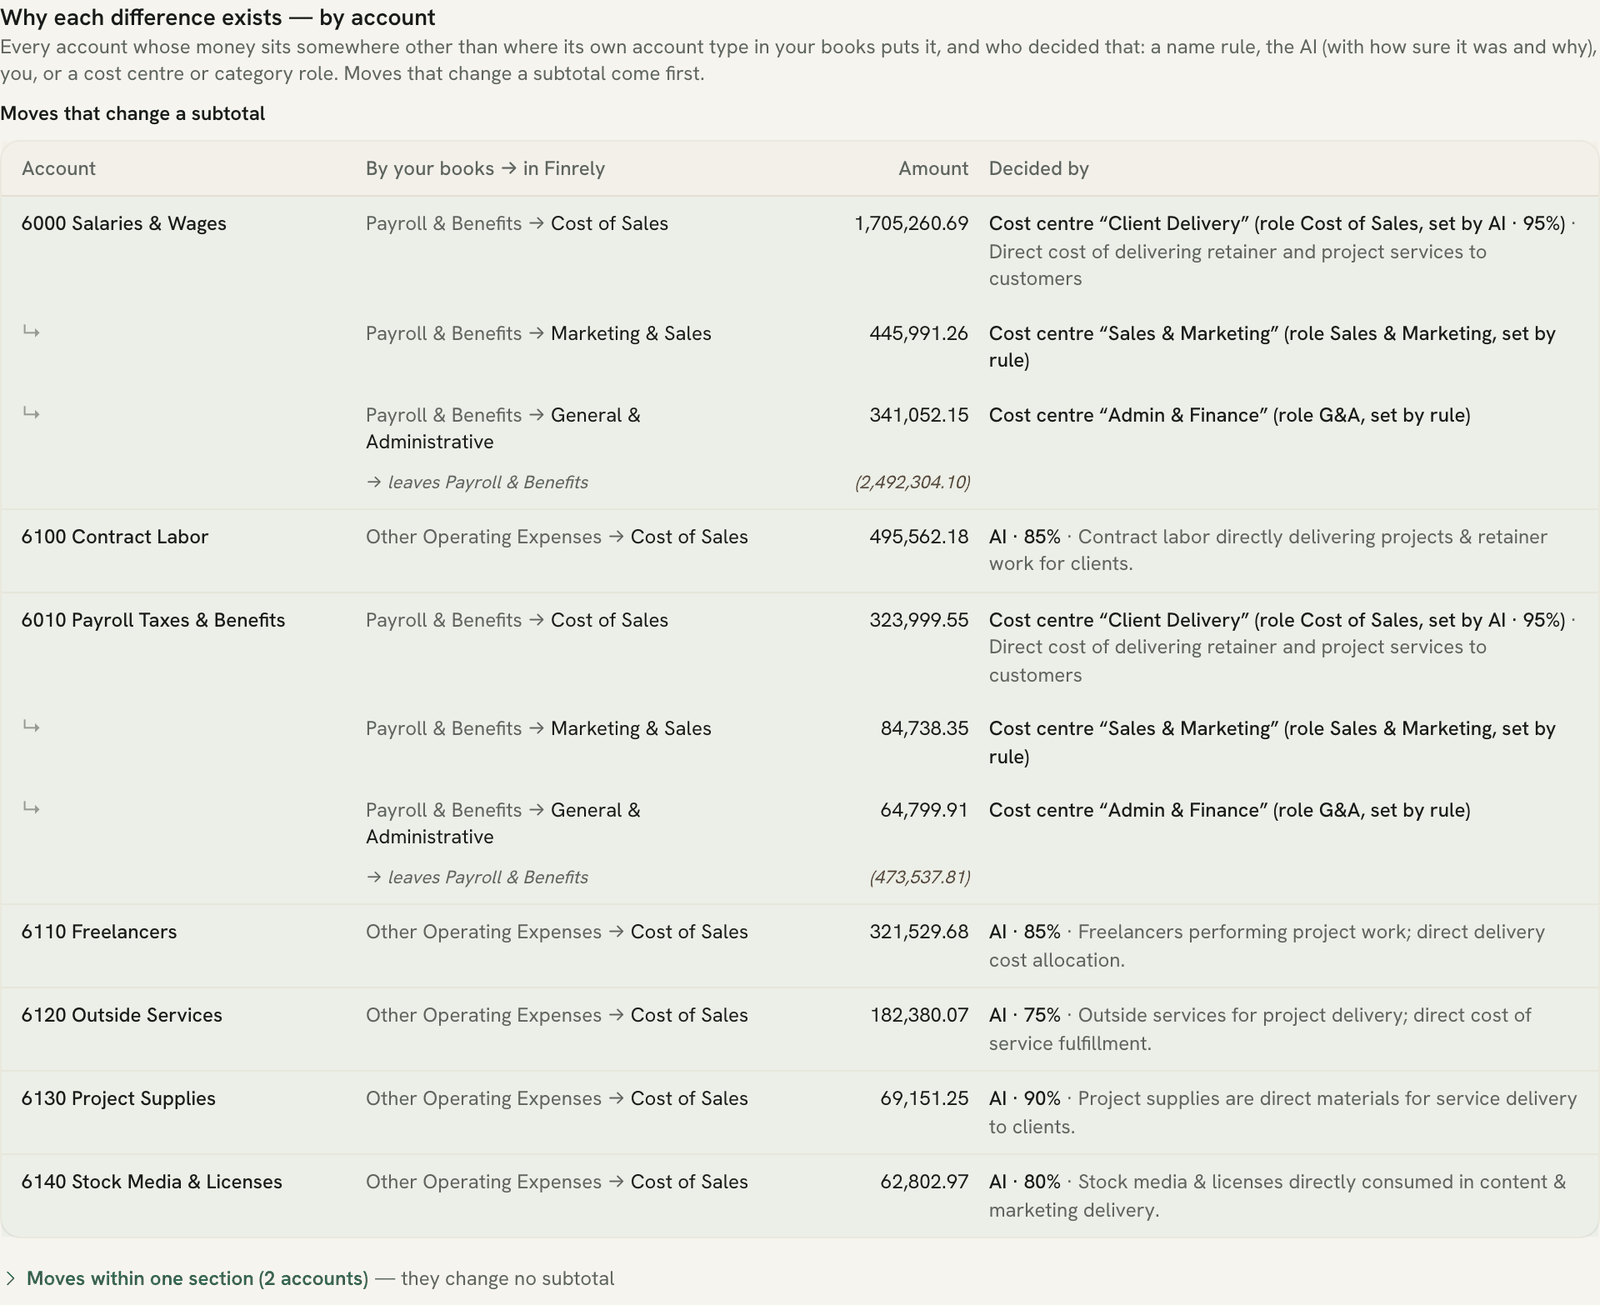
Each row says where the account sits in your books, where it sits in Finrely, how much moved, and who decided:
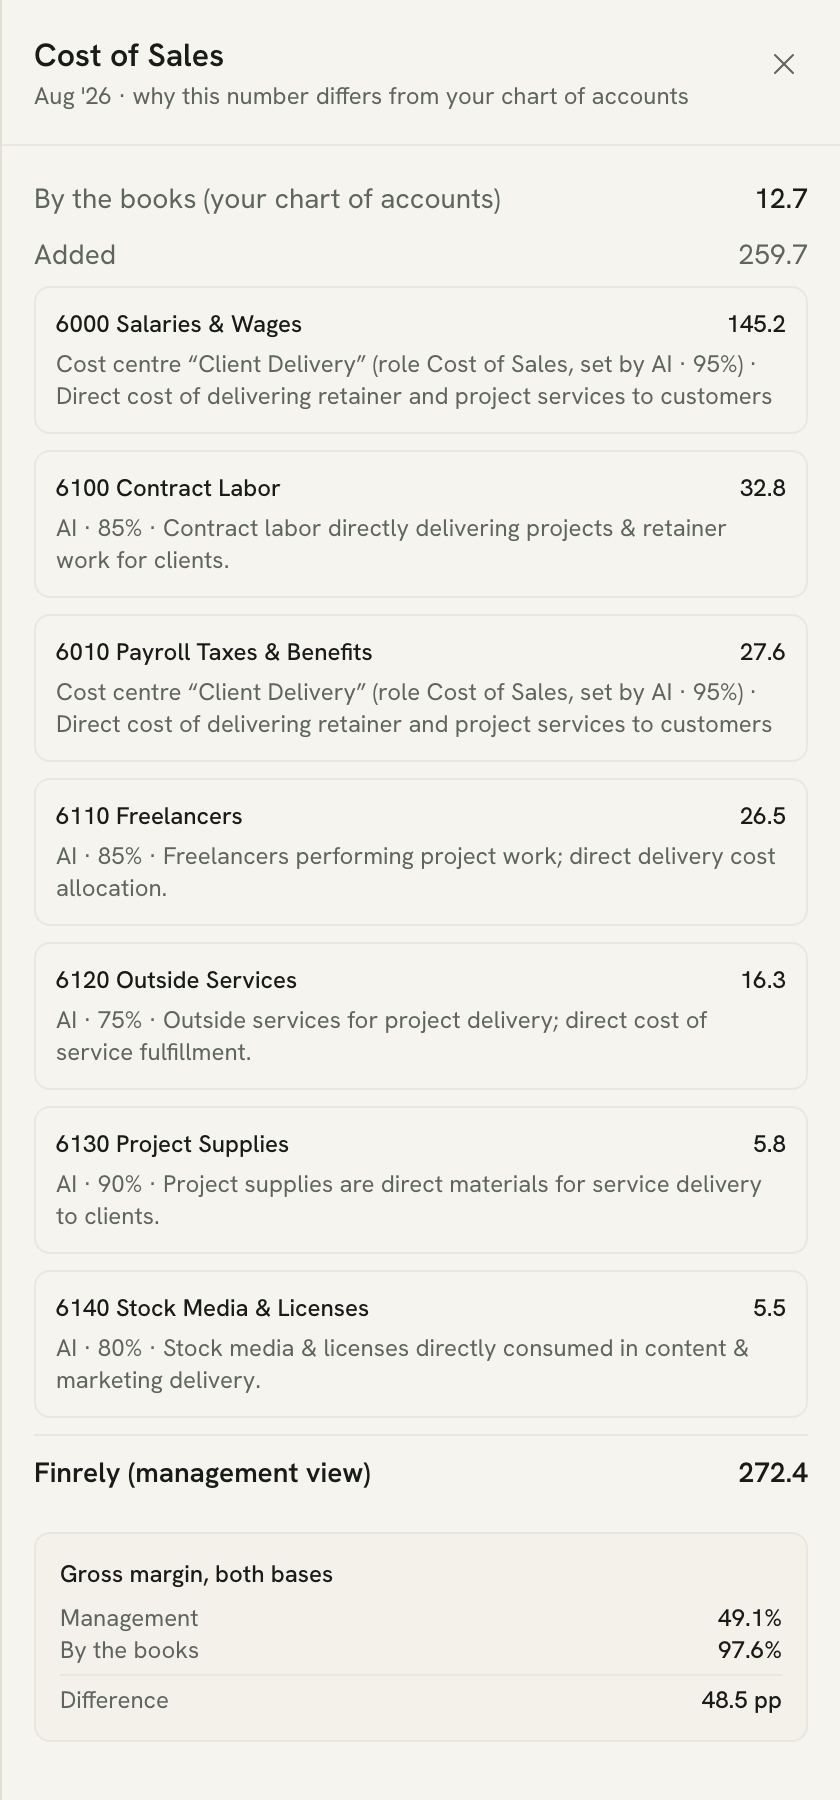
- A cost-centre role. $1,705,260.69 of salaries tagged “Client Delivery” moved from payroll to cost of sales, because that cost centre’s role is cost of sales. The role itself was set by the AI at 95% confidence, with its reason shown.
- The AI, with its confidence and reason. Contract Labor, $495,562.18, at 85%: “Contract labor directly delivering projects & retainer work for clients.” Outside Services at 75%. Project Supplies at 90%.
- A name rule, for the plain cases.
- You, for any placement you set yourself.
Moves that change a subtotal come first. Moves within one section, which change no subtotal, are folded underneath.
The same explanation sits on the P&L itself. Every changed line carries a marker, and opening it shows that month’s reconciliation for the line:
The report also works on a phone, which matters more than it sounds when the question comes up in a meeting:
How to use it
A few situations where this earns its place:
Before a board pack or an investor update. Check the whole-statement table first. The bottom line must say “identical in both”. Then you know any difference in gross margin is a presentation you can defend line by line.
When your accountant’s margin disagrees with yours. Open the by-account table together. The disagreement turns into a list: which accounts moved, how much, and on what basis. You can both be right - one P&L for the tax return, one for running the company - as long as the list explains every dollar between them.
When the AI made a call you disagree with. Its confidence and reason are on the row. A 75% placement deserves a second look; a 95% one usually doesn’t.
When a large amount says “untagged”. Money left on its account’s line because a posting carried no cost centre is a tagging question in your accounting system, not an error in the report. On Larkspur, $156,096.92 of payroll stays on the payroll line for exactly that reason.
The second check: against your accounting system itself
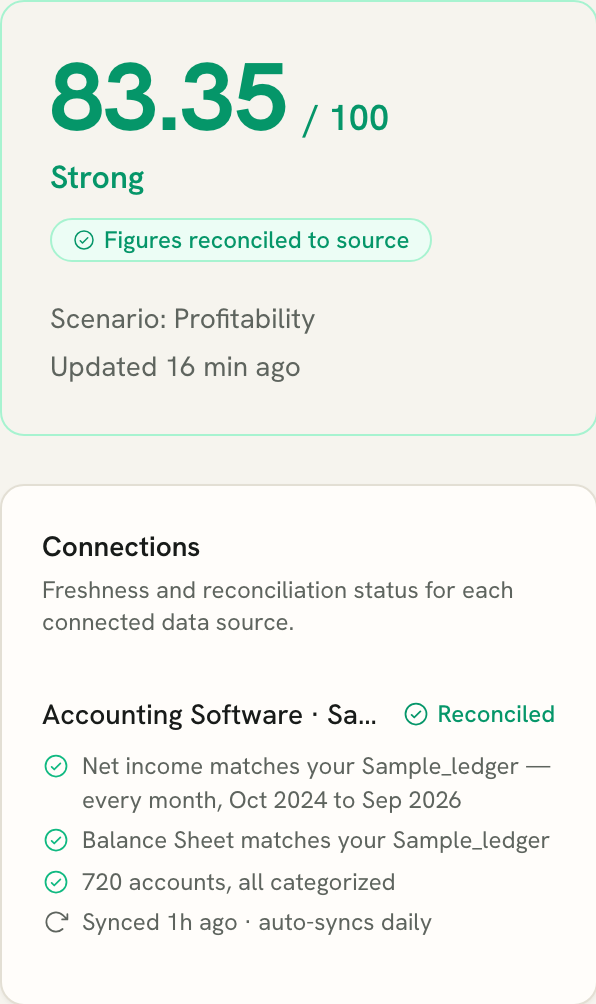
The reconciliation compares the two views of the same data. A different control checks the data itself: every month, Finrely compares its own net income and balance sheet totals with the totals your accounting system reports for that month, where the system provides them. When they agree, the Data Quality page says so:
Where this stops
A page about trust that leaves out its own limits is not a page about trust.
- P&L only. Balance sheet lines are not regrouped this way, and the cash flow statement follows the balance sheet, so there is no equivalent reconciliation for either.
- One company at a time. The reconciliation is not available on a consolidated group.
- No export yet. The report lives in the app. You cannot send it to your accountant as a file today, which is an obvious gap for the person it was built for.
- It depends on your books. Placement works on account names and on what the company earns; regrouping works on what is tagged. A company with no cost centres at all sees fewer moves, and that is honest rather than broken. Support for cost-centre roles is not yet identical across every accounting system we connect to.
- Read-only, always. Nothing is written back to your accounting system.
Three questions to ask any reporting tool
Useful whether or not you ever look at Finrely.
- Does your gross margin match my accounting P&L? If the answer is a confident yes, ask what happens when the real cost of delivery is not sitting in cost-of-sales accounts.
- If it does not match, can you show me every difference, by account, and who decided it? A methodology summary is not an answer. A list is.
- Does the bottom line match? This one is not a matter of taste.
Larkspur kept the 50%. It is the right number for how the business actually runs. What changes is that the gap to the books stops being an argument and becomes a page you can hand to your accountant.
Related reading: Three ways to assemble management reporting and How to know which numbers in your dashboard you can trust.
See it on your own numbers
Connect a source and watch a board-ready pack assemble itself - every figure traceable.